Google Analytics 4: wat is nieuw?
Introduction
Google announced in 2022 that Universal Analytics will be permanently replaced by a new variant from July 1, 2023, namely Google Analytics 4. In the meantime, Universal Analytics is permanently out of use. Google Analytics 4 brings a lot of new features. A new data model, the start of automatic insights and the introduction of the engagement rate, easy cross-platform measurement and more. We share the most important changes in this blog.
1. New way of measuring
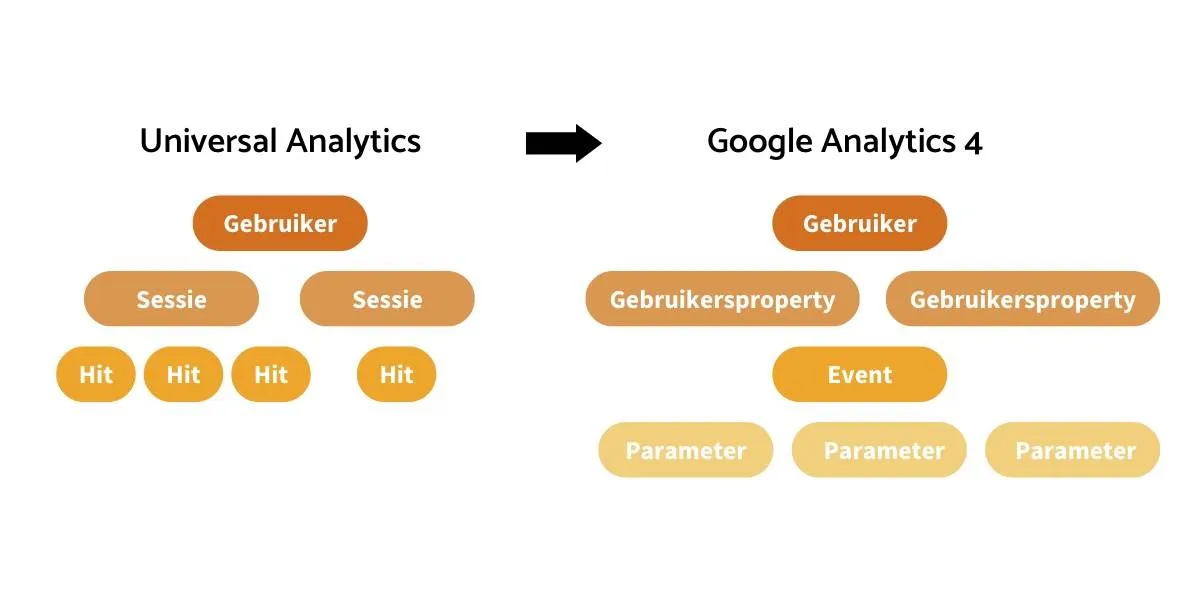
The biggest difference between Universal Analytics and GA4 is the way data is collected. Google Analytics 4 introduces a new data model: the event-driven data model. From now on, all interactions on the website will be measured as an event).
Types of interactions include: starting a session (visit), scrolling a web page, purchasing a product, watching a video, page views, and so on. In Universal Analytics these were different hit types. In Google Analytics 4 they all fall under “events”.
Practical example
Peter and Sarah both surf to www.rd-webdesign.be. Peter ends up on the homepage, but returns to Google. Sarah, on the other hand, scrolls through the homepage, clicks through to our e-books and downloads a free file.
Universal Analytics measures the following data: two users and two sessions. Google Analytics 4 measures one user with one event (Peter, page view) and one user with different events (Sarah, scroll + page views + download).
1.1 Standard events (via improved measurement)
Thanks to the “enhanced measurement” events are measured automatically, without you having to set anything in Google Analytics or Google Tag Manager. Events that are measured automatically are:
- Page views (page_view)
- Scrolls (scroll)
- Outgoing clicks (click)
- Search on website
- Watch video
- Downloads
Not a fan of this option? Google Analytics 4 offers the possibility to disable this via property settings.

1.2 Recommended events
In addition to the standard events, Google also offers a list of recommended events on. You can add this yourself if you wish.
1.3 Configure your own events
Would you like to have an interaction on your website measured as an event? Create a custom event and determine the name and parameters yourself. (Tip: this way you can also transfer existing events from Universal Analytics to Google Analytics 4). You can then mark events as “conversion”. In total you can set about 500 events, of which you can mark 30 as “conversion”. More information about custom events can be found here.
What are parameters?
Within Google Analytics 4 you can add parameters to every event. Parameters are the data measured during an event. This way we gain more insight into the what, where, why and how of each event.
Two examples to clarify this:
Event: Page views (page_view)
Parameters: URL of page, URL of previous page, time spent on page.
Event: Watch video
Parameters: Video URL, video title, video duration, ...
Just like with events, there are both automatic and custom parameters.
2. Bounce rate versus engagement rate
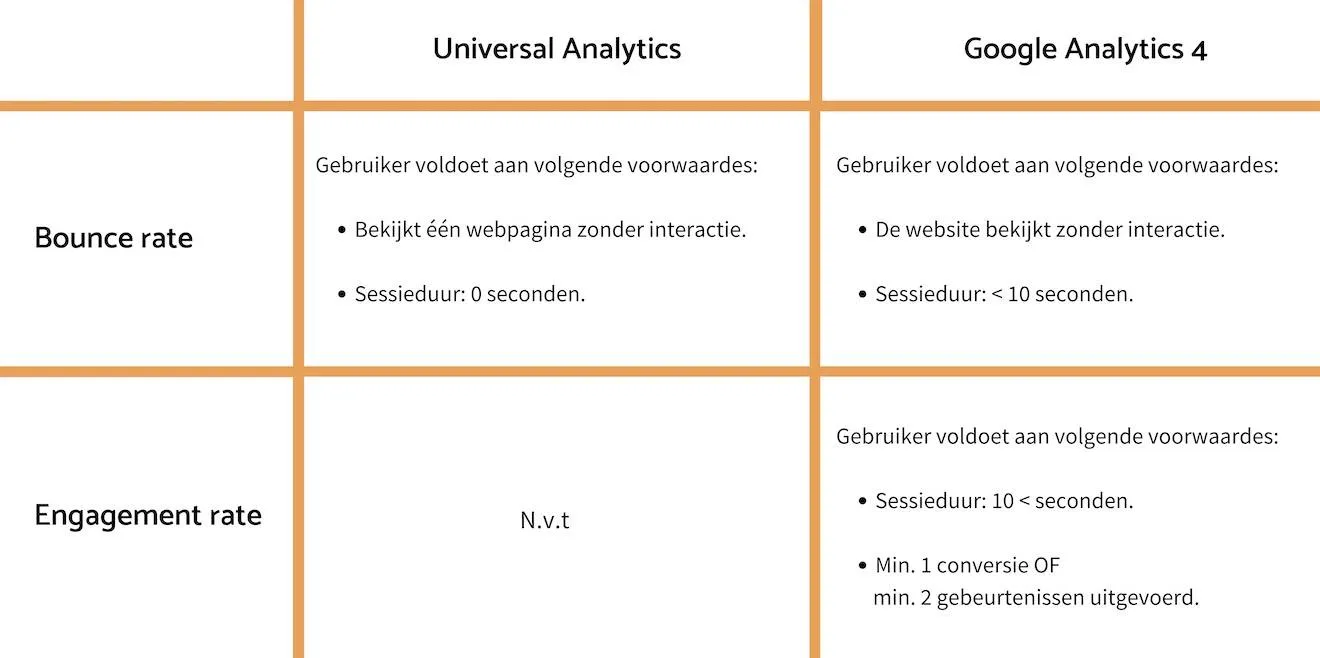
In Google Analytics 4, the original bounce percentage (= bounce rate) is measured differently and the engagement percentage (= engagement rate) is introduced. Just a refresher: The bounce percentage is the percentage of visitors who view the website and then leave without any interaction on the website (= bouncers). The engagement rate is the opposite and includes the percentage of visitors who actively visit the website and interact (= sessions with engagement).
When do you count a “bounce” or a “session with engagement”?

In a nutshell: when the website visit is not seen as a session with engagement, then we only speak of a “bounce”. You can find more information about this here.
4. Easier to manage target groups
Google Analytics 4 allows you to create target groups based on what users (= website visitors) have done on your website. Moreover, based on previously collected data, you can automatically group users into a target group that is likely to return to your website within 7 days. You can find more about predictive target groups here.

5. Automatic insights
Receive a warning when the demand for products is higher than normal? Calculate the probability that a target group will convert? Thanks machine learning promises Google Analytics 4 new insights to predict. Something that many marketers are looking forward to!
6. Customer-oriented reporting and the Analysis Hub
Google Analytics 4 has also reinvented itself in terms of reporting. All information is now organized in folders, with the focus again on the entire customer life cycle. You can see how customers come in through the acquisition reports, how they behave through the engagement reports and whether they come back for a purchase through the >retention reports. Do you prefer to see detailed reports? Consult the new Analysis Hub (or "Discover") and make connections between your statistics, audiences and insights. In addition, you will also find the well-known path, funnel and segment analysis reports here (as we know them from Universal Analytics).